The Azure Databricks Spark engine has capabilities to ingest, structure and process vast quantities of event data, and use analytical processing and machine learning to derive insights from the data at scale. Power BI can be used to visualize the data and deliver those insights in near-real time.
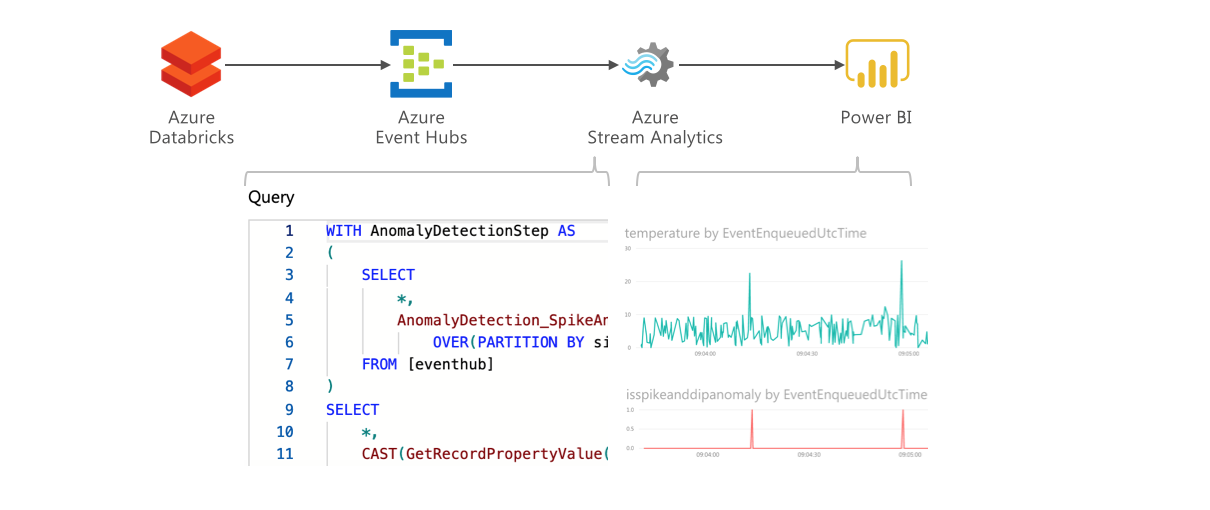
Streaming data can be delivered from Azure Databricks to Power BI using Event Hubs and Stream Analytics. Event Hubs allows massive stream processing and can also be used to deliver the data to other consumers. Stream Analytics includes a complex event processing engine which can be used to structure the data for consumption, for example, averaging sensor values over time windows or automatically detecting anomalies.
Walkthrough
Simple End-to-end flow
We will create a simple Databricks streaming job generating random temperature data for a number of sites.
In the Azure Portal, create a new Event Hubs namespace with the Basic pricing tier and all options as default.
Under the Event Hubs namespace, go to the Event Hubs pane and create a new Event Hub named temperatures with all options as default.
Under the Event Hubs namespace, go to the Shared access policies pane and add a new policy named SendFromDatabricks with Send privilege.
Navigate to the newly created policy and copy the primary connection string.
Create a new Databricks cluster with all options as default.
Create a library in your Azure Databricks workspace using the Maven coordinate com.microsoft.azure:azure-eventhubs-spark_2.11:2.3.9, and attach the library to your cluster.
Create a new Scala Notebook and enter the following code. Replace MYSERVICEBUSCONNECTIONSTRING with the Service Bus connection string.
 import org.apache.spark.eventhubs.{ ConnectionStringBuilder, EventHubsConf }
 import org.apache.spark.sql.streaming.Trigger
 val connectionString = ConnectionStringBuilder("MYSERVICEBUSCONNECTIONSTRING")
   .setEventHubName("temperatures")
   .build
 val eventHubsConfWrite = EventHubsConf(connectionString)
 val inputDf = spark.readStream
   .format("rate")
   .option("rowsPerSecond", 10)
   .load()
 inputDf.createOrReplaceTempView("stream")
 val resultDf = spark.sql("select to_json(struct(value as row_id, string(int(RAND()*10)) as site_id, int(RAND() * 100)/10 + CASE WHEN RAND()>0.99 THEN 20 ELSE 0 END as temperature)) as body from stream")
 val query =
   resultDf
     .writeStream
     .option("checkpointLocation", "/tmp/eventhub-pbi-tutorial-cp")
     .format("eventhubs")
     .outputMode("append")
     .options(eventHubsConfWrite.toMap)
     .start()
Run the cell. Expand the streaming job to view statistics.
In the Azure Portal, create a new Stream Analytics job with all options as default. In the Inputs pane, create a new input named eventhub and select your Event Hub. Click Save.
In the Outputs pane, create a new output named powerbi . Click Authorize, go through the authorization process. Select My workspace and enter walkthrough as dataset name and temperatures as table name. Click Save.
In the Query pane, enter the following query and click Save.
SELECT
    *
INTO
    [powerbi]
FROM
    [eventhub]
In the Overview pane, click Start and start the job.
Log in to Power BI Service at https://powerbi.com. Navigate to My Workspace and to Datasets. Locate the walkthrough dataset.
Under ACTIONS, click the first icon (Create report). Select the Line chart visual and check the EventEnqueuedUtcTime and temperature columns.
Click the Pin icon on the Line chart to add the visual to a dashboard. Save the report when prompted, and select a new Dashboard. Enter a name and save. Navigate to the Dashboard and view the streaming data in real time.
Anomaly Detection
The Databricks job is set up so that one in hundred temperature measurements on average are anomalously high. Azure Stream Analytics includes an an-built anomaly detection capability. Let us now change the Stream Analytics job definition to detect the anomalies automatically.
In the Azure Stream Analytics job Overview pane, click Stop to stop the job. Wait until the job is stopped.
In the Output panes, click on the Power BI dataset and change the dataset name to walkthroughWithAnomaly. Click Save.
In the Query pane, change the query definition to the following:
WITH AnomalyDetectionStep AS
(
    SELECT
        *,
        AnomalyDetection_SpikeAndDip(CAST(temperature AS float), 99, 150, 'spikesanddips')
            OVER(PARTITION BY site_id LIMIT DURATION(second, 600)) AS SpikeAndDipScores
    FROM [eventhub]
)
SELECT
    *,
    CAST(GetRecordPropertyValue(SpikeAndDipScores, 'Score') as FLOAT) AS
    SpikeAndDipScore,
    CAST(GetRecordPropertyValue(SpikeAndDipScores, 'IsAnomaly') AS BIGINT) AS
    IsSpikeAndDipAnomaly
INTO [powerbi]
FROM AnomalyDetectionStep
In Power BI, navigate to Datasets, locate the walkthroughWithAnomaly dataset. Add a filter for site_id and select one site. Generate visuals to view both the temperature and anomaly detection flag and/or score. You can experiment with the parameters in the AnomalyDetection_SpikeAndDip function of the Stream Analytics job to find the best settings.