Various interactive options are available to inspect messages in Azure Event Hubs or IoT Hubs, such as Azure Portal, Service Bus Explorer (Windows only) or Azure IoT Explorer.
However, for developer convenience or scripting automation, you may prefer using a CLI tool to stream the messages directly into a console or file. The Kafka Console Consumer is a great tool for doing this, using the built-in Kafka endpoint available in Event Hubs and IoT Hub.
The walkthrough below illustrates using the Azure IoT Device Telemetry Simulator to produce a sample message load, together with the Kafka Console Consumer to consume those messages, both running in Docker.
Table of Contents
With Azure Event Hubs
Create an Azure Event Hubs namespace in Standard tier with all settings as default. In the namespace, create an Event Hub named test.
Create a file docker-compose.yml with the following content:
version: "3.5"
services:
  simulator:
    image: iottelemetrysimulator/azureiot-telemetrysimulator
    environment:
      EventHubConnectionString: "$EVENTHUBS_CONNECTIONSTRING;EntityPath=$EVENT_HUB_NAME"
      MessageCount: 0
    deploy:
      restart_policy:
        condition: on-failure

  dumper:
    image: confluentinc/cp-kafka:6.2.0
    # see https://github.com/Azure/azure-event-hubs-for-kafka/tree/master/quickstart/kafka-cli
    command:
    - /bin/bash
    - -euxc
    - |
      echo -e 'security.protocol=SASL_SSL\nsasl.mechanism=PLAIN' > client_common.properties
      echo -e 'KafkaClient { org.apache.kafka.common.security.plain.PlainLoginModule required username="$$ConnectionString" password="$EVENTHUBS_CONNECTIONSTRING"; }; ' > jaas.conf
      export KAFKA_OPTS="-Djava.security.auth.login.config=jaas.conf"
      kafka-console-consumer --topic $EVENT_HUB_NAME --bootstrap-server $EVENTHUBS_ENDPOINT --consumer.config client_common.properties
Create a file run-solution.sh with the following content:
#!/bin/bash

set -euo pipefail

rg="$1"
namespace="$2"
topic="$3"

export EVENTHUBS_CONNECTIONSTRING=$(az eventhubs namespace authorization-rule keys list --resource-group "$rg" --namespace-name "$namespace" --name RootManageSharedAccessKey --query primaryConnectionString -o tsv)
export EVENTHUBS_ENDPOINT="$namespace.servicebus.windows.net:9093"
export EVENT_HUB_NAME="$topic"

docker-compose up
Run the script passing your resource group name, namespace name and Event Hub name as arguments.
bash run-solution.sh MY_RESOURCE_GROUP MY_NAMESPACE testCreating eventhubs_simulator_1 ... done
Creating eventhubs_cat_1 ... done
Creating eventhubs_dumper_1 ... done
Attaching to eventhubs_cat_1, eventhubs_dumper_1, eventhubs_simulator_1
simulator_1 | Starting simulator v1.0
dumper_1 | {"deviceId": "sim000001", "time": "2021-06-25T11:12:47.0829887Z", "counter": 11}
dumper_1 | {"deviceId": "sim000001", "time": "2021-06-25T11:12:48.1410210Z", "counter": 12}
dumper_1 | {"deviceId": "sim000001", "time": "2021-06-25T11:12:49.1927594Z", "counter": 13}
dumper_1 | {"deviceId": "sim000001", "time": "2021-06-25T11:12:50.2480419Z", "counter": 14}
dumper_1 | {"deviceId": "sim000001", "time": "2021-06-25T11:12:51.2961822Z", "counter": 15}With Azure IoT Hubs
Create an Azure IoT Hub instance with all settings as default.
Create a file docker-compose.yml with the following content:
version: "3.5"
services:
  provisioner:
    image: iottelemetrysimulator/azureiot-simulatordeviceprovisioning
    environment:
      IotHubConnectionString: $REGISTRY_CONNECTIONSTRING
  simulator:
    image: iottelemetrysimulator/azureiot-telemetrysimulator
    environment:
      IotHubConnectionString: $DEVICE_CONNECTIONSTRING
      MessageCount: 0
    deploy:
      restart_policy:
        condition: on-failure

  dumper:
    image: confluentinc/cp-kafka:6.2.0
    # see https://github.com/Azure/azure-event-hubs-for-kafka/tree/master/quickstart/kafka-cli
    command:
    - /bin/bash
    - -euxc
    - |
      echo -e 'security.protocol=SASL_SSL\nsasl.mechanism=PLAIN' > client_common.properties
      echo -e 'KafkaClient { org.apache.kafka.common.security.plain.PlainLoginModule required username="$$ConnectionString" password="$EVENTHUBS_CONNECTIONSTRING"; }; ' > jaas.conf
      export KAFKA_OPTS="-Djava.security.auth.login.config=jaas.conf"
      kafka-console-consumer --topic $EVENT_HUB_NAME --bootstrap-server $EVENTHUBS_ENDPOINT --consumer.config client_common.properties
Create a file run-solution.sh with the following content:
#!/bin/bash

set -euo pipefail

iothub="$1"

if ! [ -e .env ]; then
  props=$(az iot hub show -n $iothub --query '[{endpoint: properties.eventHubEndpoints.events.endpoint,path:properties.eventHubEndpoints.events.path}]' -o tsv)
  read -r EVENTHUBS_ENDPOINT EVENT_HUB_NAME <<< "$props"
  DEVICE_CONNECTIONSTRING=$(az iot hub connection-string show -n $iothub --policy-name device -o tsv)
  REGISTRY_CONNECTIONSTRING=$(az iot hub connection-string show -n $iothub --policy-name registryReadWrite -o tsv)
  EVENTHUBS_CONNECTIONSTRING=$(az iot hub connection-string show --hub-name $iothub --default-eventhub -o tsv)
  EVENTHUBS_ENDPOINT=${EVENTHUBS_ENDPOINT#sb://}
  EVENTHUBS_ENDPOINT=${EVENTHUBS_ENDPOINT%/}
  echo "EVENTHUBS_ENDPOINT=$EVENTHUBS_ENDPOINT:9093" >> .env
  echo "EVENT_HUB_NAME=$EVENT_HUB_NAME" >> .env
  echo "DEVICE_CONNECTIONSTRING=$DEVICE_CONNECTIONSTRING" >> .env
  echo "REGISTRY_CONNECTIONSTRING=$REGISTRY_CONNECTIONSTRING" >> .env
  echo "EVENTHUBS_CONNECTIONSTRING=$EVENTHUBS_CONNECTIONSTRING" >> .env
fi

cat .env

docker-compose up
Run the script passing your IoT Hub name as argument.
bash run-solution.sh MY_IOT_HUB
WARNING: Found orphan containers (iot_jq_1) for this project. If you removed or renamed this service in your compose file, you can run this command with the --remove-orphans flag to clean it up.
Starting iot_simulator_1 ... done
Starting iot_provisioner_1 ... done
Starting iot_dumper_1 ... done
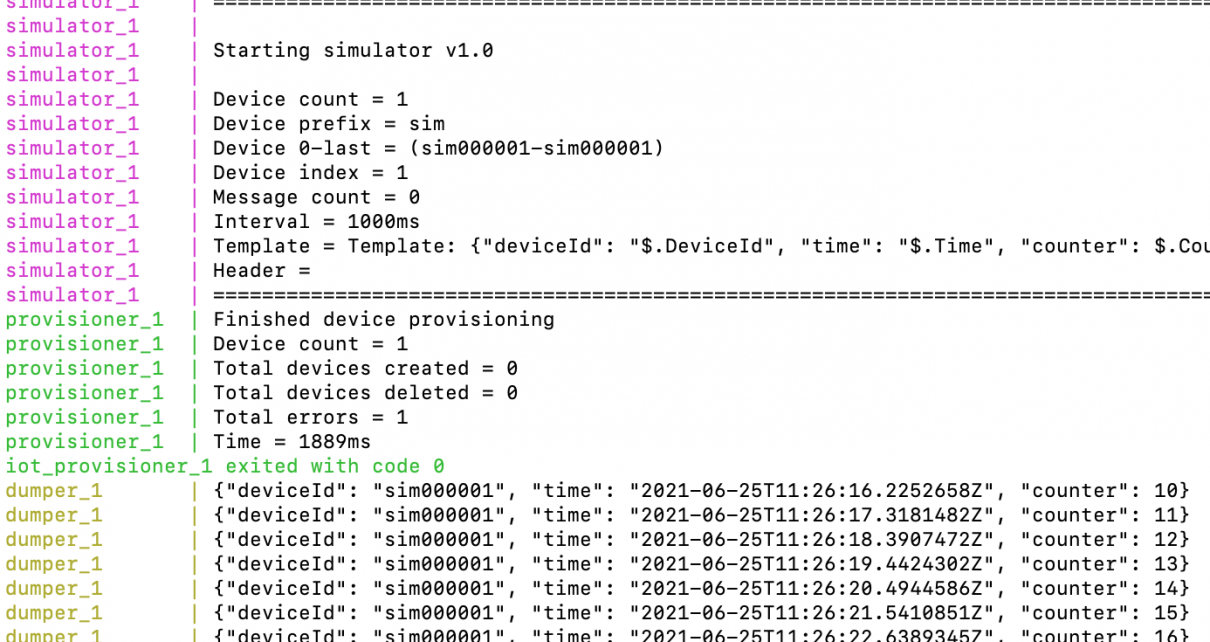
Attaching to iot_provisioner_1, iot_dumper_1, iot_simulator_1
provisioner_1 | Starting device provisioning
provisioner_1 | Finished device provisioning
provisioner_1 | Device count = 1
provisioner_1 | Total devices created = 0
provisioner_1 | Total devices deleted = 0
provisioner_1 | Total errors = 1
provisioner_1 | Time = 2329ms
iot_provisioner_1 exited with code 0
simulator_1 |
simulator_1 | Starting simulator v1.0
simulator_1 |
simulator_1 | Device count = 1
simulator_1 | Device prefix = sim
simulator_1 | Device 0-last = (sim000001-sim000001)
simulator_1 | Device index = 1
simulator_1 | Message count = 0
simulator_1 | Interval = 1000ms
simulator_1 | Template = Template: {"deviceId": "$.DeviceId", "time": "$.Time", "counter": $.Counter}
dumper_1 | {"deviceId": "sim000001", "time": "2021-06-25T10:04:16.0151091Z", "counter": 13}
dumper_1 | {"deviceId": "sim000001", "time": "2021-06-25T10:04:17.2424891Z", "counter": 14}
dumper_1 | {"deviceId": "sim000001", "time": "2021-06-25T10:04:18.4959163Z", "counter": 15}
dumper_1 | {"deviceId": "sim000001", "time": "2021-06-25T10:04:19.6447100Z", "counter": 16}With kafkacat
The docker-compose.yml files above uses kafka-console-producer. Alternatively, the kafkacat utility can be used. As it’s written in C, it has a faster start-up time, and great
options to inspect metadata and format the output.
kafkacat:
    image: confluentinc/cp-kafkacat:5.3.5
    command:
    - /bin/bash
    - -euxc
    - |
      kafkacat \
        -t $EVENT_HUB_NAME \
        -b $EVENTHUBS_ENDPOINT \
        -X security.protocol=SASL_SSL \
        -X sasl.mechanism=PLAIN \
        -X sasl.username='$$ConnectionString' \
        -X sasl.password='$EVENTHUBS_CONNECTIONSTRING' \
        -C \
        -o end
Sample application: load testing
We will increase the event rate and use a one-line shell script to compute the number of messages received per second.
From the Event Hubs example above, modify the docker-compose.yml file to write the dumped output to a data file:
  dumper:
    image: confluentinc/cp-kafka:6.2.0
    volumes:
      - data-volume:/var/tmp
    command:
    - /bin/bash
    - -euxc
    - |
      echo -e 'security.protocol=SASL_SSL\nsasl.mechanism=PLAIN' > client_common.properties
      echo -e 'KafkaClient { org.apache.kafka.common.security.plain.PlainLoginModule required username="$$ConnectionString" password="$EVENTHUBS_CONNECTIONSTRING"; }; ' > jaas.conf
      export KAFKA_OPTS="-Djava.security.auth.login.config=jaas.conf"
      kafka-console-consumer --topic $EVENT_HUB_NAME --bootstrap-server $EVENTHUBS_ENDPOINT --consumer.config client_common.properties > /var/tmp/data.json
In the docker-compose.yml file, add a container to regularly report statistics, and the data volume definition:
  jq:
    image: stedolan/jq
    volumes:
      - data-volume:/var/tmp
    entrypoint: /bin/bash
    command:
    - -euc
    - |
      trap 'exit' SIGINT
      while true; do
        cat /var/tmp/data.json|jq .|grep time|cut -f1 -d.|sort|uniq -c|tail -10
        echo ===================================================================
        sleep 10
      done

volumes:
  data-volume:
Under the environment section of the simulator container, add settings to generate 100 events per second:
        DeviceCount: 10
        Interval: 100  # in milliseconds
Running the script again shows that the event rate is stable:
simulator_1  | 2021-06-25T11:44:11.7620481Z: 1700 total messages have been sent @ 100.21 msgs/sec
simulator_1  | 2021-06-25T11:44:12.7539624Z: 1800 total messages have been sent @ 100.82 msgs/sec
simulator_1  | 2021-06-25T11:44:13.7602160Z: 1900 total messages have been sent @ 99.38 msgs/sec
simulator_1  | 2021-06-25T11:44:14.7539800Z: 2000 total messages have been sent @ 100.63 msgs/sec
jq_1         |     100   "time": "2021-06-25T11:44:11
jq_1         |     100   "time": "2021-06-25T11:44:12
jq_1         |     100   "time": "2021-06-25T11:44:13
jq_1         |      70   "time": "2021-06-25T11:44:14
jq_1         | ===================================================================
If you do not manage to reach this rate, your latency might be too high. You could try running from an Azure Virtual Machine.