This is the second post in our series on Monitoring Azure Databricks. See Monitoring and Logging in Azure Databricks with Azure Log Analytics and Grafana for an introduction. Here is a walkthrough that deploys a sample end-to-end project using Automation that you use to quickly get overview of the logging and monitoring functionality.
The provided sample project is for illustration/demo purposes only. Credentials are not managed securely in the build pipeline. Grafana is deployed in an Azure WebApp Container without persistent storage, and your changes could be lost at any time. You could use the sample project as a base, changing it to use Key Vault to securely manage credentials, and attach a persistent store to the Grafana container.
Table of Contents
Walkthrough
Setting up the environment
To get started, you will need a Pay-as-you-Go or Enterprise Azure subscription. A free trial subscription will not allow you to create Databricks clusters.
Create an Azure Resource Group in a location of your choice.
Create an Azure Databricks workspace. Select a name and region of your choice. Select the standard tier.
Navigate to the Azure Databricks workspace. Generate a token and save it securely somewhere.
Navigate to and log in with your Azure AD credentials. Create a new Organization when prompted, or select an existing Organization if you’re already part of one.
Create a new Project.
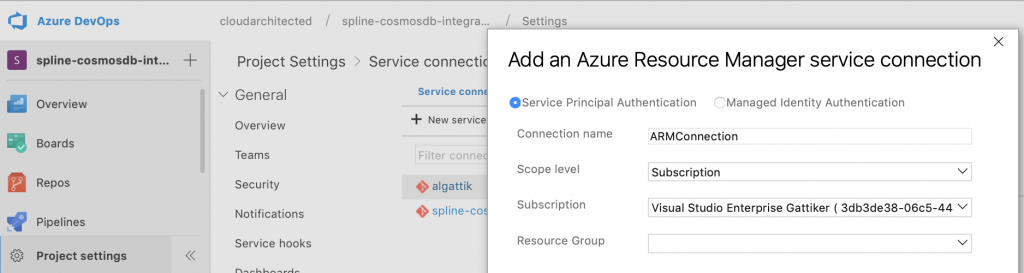
Navigate to Project settings > Service connections. Create a new service connection of type Azure Resource Manager. Name the connection ARMConnection. Select the subscription. Leave the resource group blank and click OK.
Navigate to Repos > Files, click the Import button and enter https://github.com/algattik/databricks-monitoring-tutorial.
Create a service principal to be used by Grafana to connect to Log Analytics. The easiest way is to open the CLI in the Azure Portal, and run:
az ad sp create-for-rbac --role "Log Analytics Reader"
This will create a new service principal with permissions to query any Log Analytics workspaces in the default subscription. From the command output, take note of the appId (Client ID) and password (Client Secret) as you will need them to configure the pipeline.
Creating the pipeline
Navigate to Pipelines > Builds, click New Pipeline, select Azure Repos Git and select your repository. The build pipeline definition file from source control (azure-pipelines.yml) opens. It contains a Maven task to build our Java library, and scripts tasks to provision the environment and spin sample jobs.
Update the variables as follows:
- Set RESOURCE_GROUP to the name of your resource group.
- Set DATABRICKS_HOST and _TOKEN to the base URL of your Databricks workspace, and the token you created previously. Note: managing your token this way is insecure, in production you should use Azure Key Vault instead.
- Set LOG_ANALYTICS_READER_CLIENT_ID and _SECRET to the values from the service principal you created previously. Here also is an insecure use of a secret.
Click Commit to save the pipeline. Wait until the build runs to successful completion.
The build script will provision a Log Analytics workspace, spin a Databricks Databricks connected to the Log Analytics workspace, and run two jobs that generate logs.
Using Log Analytics
Browsing the logs
After the build job completes, it may take 10-15 minutes for logs to appear in Log Analytics.
In the Azure Portal, Navigate to your Log Analytics workspace. Open the Logs panel. In the top-right corner, open the Query explorer and browse the available predefined queries.
Click one of the predefined queries with a name starting with streaming. The query appears in the query pane. Select the query and click Run. You can change the output to CHART to visualize your metrics.
Creating a custom dashboard
In the Azure Portal, Navigate to Dashboard, and click [+] New Dashboard.
Do not add any tiles to the dashboard. Type a name for your dashboard and click Done customizing.
Click the Share button and click Publish (your dashboard won’t be shared at this point with anyone who doesn’t have access to your subscription).
Return to your Log Analytics resource and create a chart again by running one of the predefined streaming queries. Click the Pin icon in the top right and select your dashboard.
Return to your dashboard. You may need to refresh the browser page for the chart to appear.
You can now experiment more advanced features of Log Analytics such as modifying queries, saving queries, importing the data within Power BI, and creating alerts.
Using Grafana
In the Azure DevOps pipeline build result, locate the activity Deploy Grafana. Click on it and scroll to the bottom of the log. You will see the URL and credentials to access Grafana.
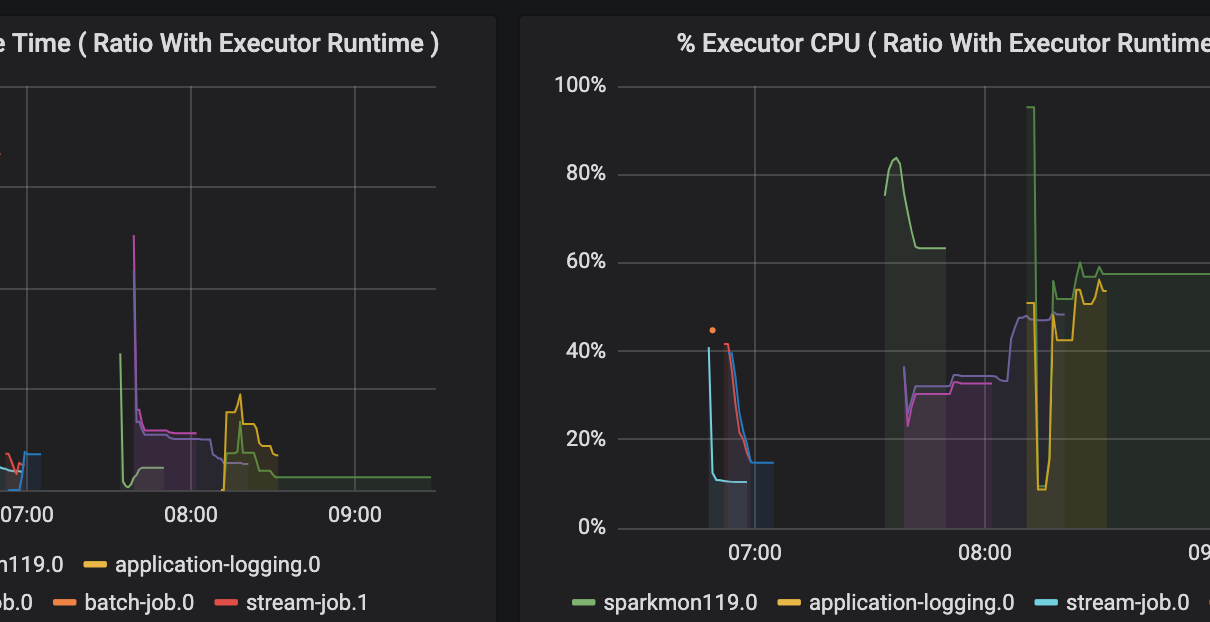
Access the URL and log in with the provided username and password. You will see a dashboard with key metrics from the sample Databricks jobs run by the pipeline. If you don’t see any data right away, wait for up to 10-15 minutes for the Databricks jobs to run.
You can change the time range, interact with the visuals, modify the view etc. Note once again that Grafana is deployed in a container without persistent storage, and your changes could be lost at any time.
Details
Build pipeline
The build pipeline spins a new Log Analytics workspace, and configures a new cluster within your Databricks workspace.
Notebooks
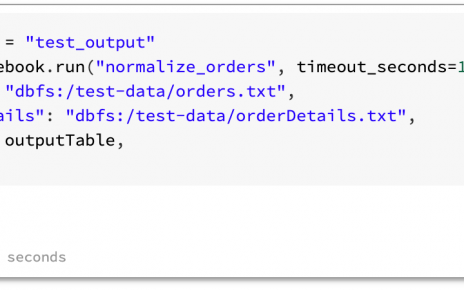
The pipeline copies and runs three notebooks into the /Shared/sample-jobs directory of your workspace. The notebooks are run with a timeout of 20 minutes, otherwise the streaming notebook would run forever. The cluster automatically shuts down after 2 hours on inactivity.
As you can see from the streaming notebook, logging metrics from Spark jobs does not need any modification or additional configuration in the code.
One notebook demonstrates how application logs can be pushed to Log Analytics. Such classes would typically be developed in a library, but we’re demonstrating this in a notebook here for simplicity.